Overview — your finances dashboard at a glance
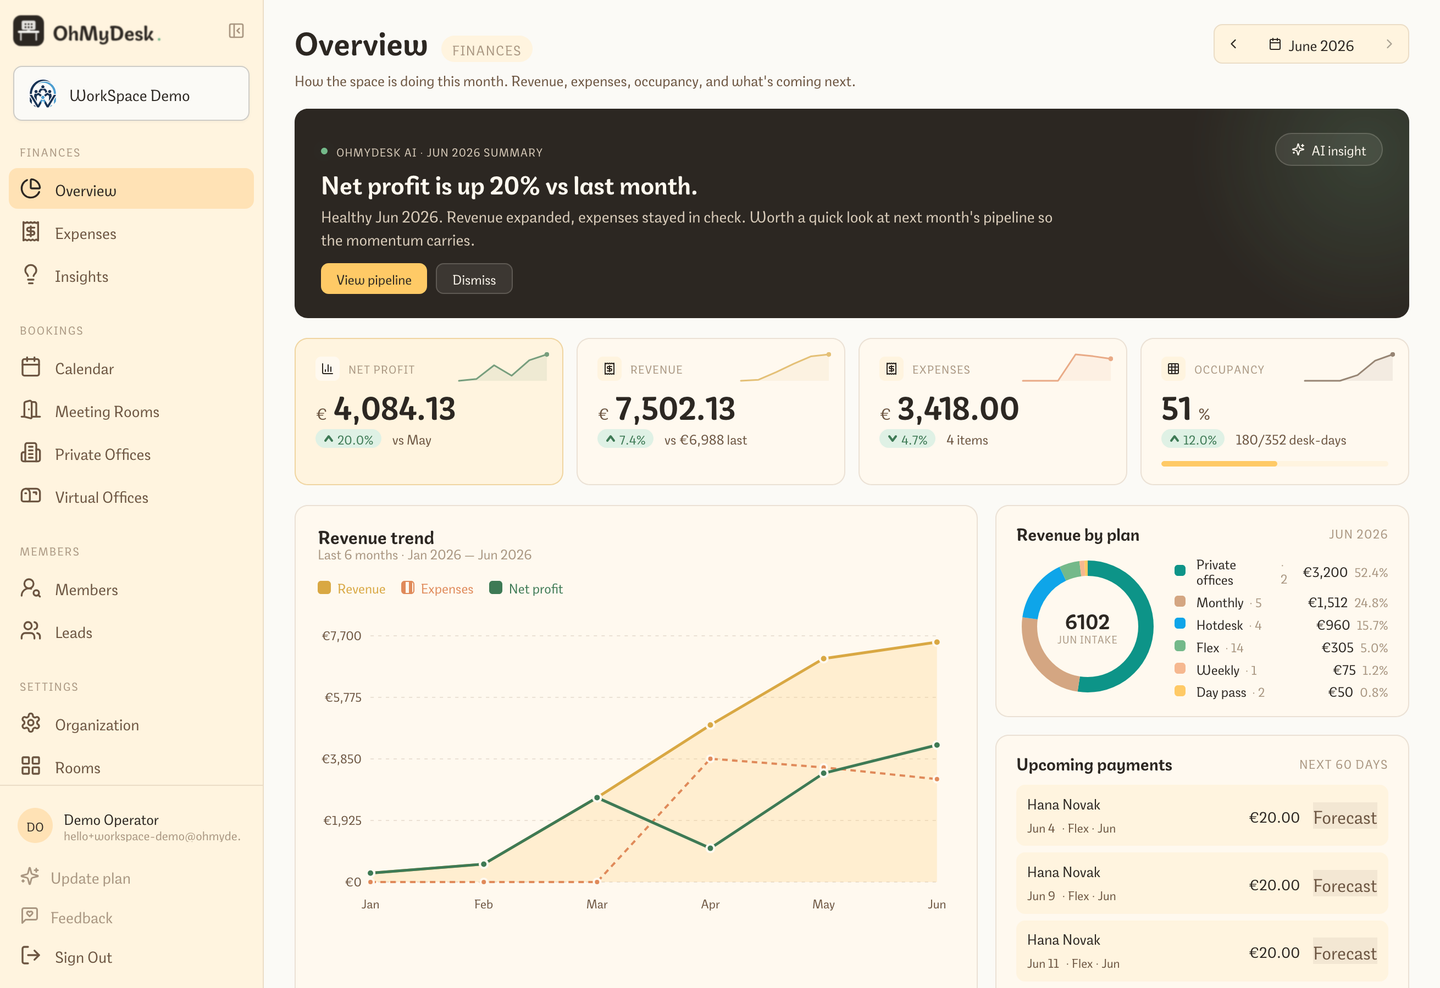
The Overview dashboard leads with Net profit, then Revenue, Expenses, and Occupancy — each with a 6-month sparkline and a delta vs last month. A Revenue-by-plan donut shows which plan type carries the month. Owner-only by default.
The old Revenue page grew into Overview, a real finances dashboard under Finances. Four KPI cards lead with Net profit — the number that actually matters — followed by Revenue, Expenses, and Occupancy, each with a 6-month sparkline and a month-over-month delta. A three-series trend chart overlays revenue, expenses, and net profit; a Revenue-by-plan donut shows which plan type is paying the bills; and Upcoming payments looks 60 days ahead.
What you get
- Net profit, Revenue, Expenses, and Occupancy KPIs with 6-month sparklines and deltas
- Three-series trend chart (revenue area, expenses, net profit) with a hover crosshair
- Choose whether revenue follows money received or services delivered; enable either view or both in Organization settings and switch the dashboard without changing any bookings
- Service-revenue totals refresh when you open Overview or save a paid booking — no overnight wait for today's day passes
- Revenue by plan donut — see which plan type carries the month
- Upcoming payments for the next 60 days, plus top contributors by share of revenue
- AI · Performance band surfaces the single most important signal to act on
- Owner-only by default — staff and members never see numbers
Try every feature free for 3 months.
No credit card. Set up your space in under two minutes.
Start Free Trial